


If you think projection of NFL offenses is a fantasy football thing, you’re missing one of the most valuable tools available to learn the game. In this RSP feature, Dwain McFarland shares his process that is rooted in 20 years of success.
Forward by Matt Waldman
Dwain McFarland is a successful high stakes fantasy player who uses data successfully to understand the tendencies of the NFL game. Although the RSP is primarily a football evaluation and analysis site for all—media, football people, and fantasy football—most associate Dwain’s expertise as solely a fantasy football skill.
A lot of Dwain’s knowledge is rooted in analytics, but he is also a student of the visual side of the game. He understands there’s a balance. And it’s developing this balance that’s a key part of learning the game.
Projection models are a valuable and underutilized tool for football analysis, period. Football teams conduct its share of projection modeling, and it would be wise for media and independent scouts and analysts to do the same.
A strong projection process grounds us in the realities of the game so we don’t over or underreact to what coaches, players, and personnel executives share with the public. It develops a greater understanding of the machinations of the game and will produce work with greater nuance.
Although I spend the majority of my time sharing the film journey, I have been doing projections for many years. I encourage you to begin working with the game’s data and with the fantastic trove of knowledge that Dwain shares below, there’s no better time to begin.
For those of you who appreciate Dwain’s expertise but simply want the answers to big questions about the current NFL season, he will be providing his projection expertise to individual situations in forthcoming RSP Newsletters between July and December that are exclusive to subscribers of the Rookie Scouting Portfolio publication. You can order the RSP at www.mattwaldman.com
-M
The Projection Journey
Projecting NFL offenses is something I have enjoyed since I was twenty-two years old. It is hard to believe this is my 20th season doing so.
I can still remember my first projection model. Based on a bad process and some faulty projection premises, the accuracy was not good. However, even though my process was bad, and the results were flawed, I began to elevate my understanding of NFL offenses beyond many of my peers because it forced me to do something very important. It forced me to learn.
In those early years, my biggest pitfall was projecting players before projecting teams. I was very in tune with the news cycles around depth charts and camp battles. So, I often had the pecking order of the offense much more accurately pegged than my fantasy football league mates who were staring at three-month-old insights in a magazine. My ranking orders were improving, but my overall accuracy on the projections themselves wasn’t.
Projecting player totals without context to the team and the league left large margins for error in my work. Each season I continued to iterate on the process. Within the first five years, I had incorporated league averages and team caps, which allowed me to begin projecting from the top down. It also allowed me to check my work.
In those same years, I set baselines for what bad, below average, average, good, and great performance looked like at each position. I also figured out approximately how many players should occupy each category every year based on NFL history and trends.
After implementing these changes, my projection accuracy levels skyrocketed. As more and more data has become available, I have continued to tweak and iterate my process every season.
About seven years ago, I made another breakthrough by building out my first coaching database.
Insights gained from this database opened up a whole new line of thinking towards projections. When it comes to pace of play, coaches are remarkably consistent. Offensive play volume projections significantly improved. Possibly, more importantly, this database allowed me to enhance the ability to predict the impacts of coaching changes.
Pairing this coaching data with expected win totals allowed me to estimate seasonal game flow (time spent leading, tied, and trailing) impact on play calling. Teams that win more typically rush more to close out games. Teams that trail more have to throw more. Understanding coaching tendencies during a neutral game script provides insights into a coaches’ mentality. Is he aggressive or conservative?
Merging the coaching data sets with roster construction then provided a final layer of context on coaching tendencies. Through this research, I found that some coaches weren’t conservative – they just had a bad quarterback or key injury that caused them to be more conservative in that season. This context also enabled me to discover which coaches stick to a certain approach and which ones are more flexible based on talent.
After integrating these components, my accuracy reached an all-time new high. Applying this knowledge and wisdom (gained through experience), I have been able to monetize my projections through the avenue of fantasy football. Competing in some of the largest tournaments in the industry, I have captured three Top 5 finishes in large fields (~8,400 entrants) over the past five seasons.
I don’t share this to brag on myself. I share it because some of you think the way I do, you need evidence.
How to Project NFL Offenses
The Ground Rules
Rule No. 1: Utilize a top-down approach.
Coaches’ year-to-year volume is amazingly consistent. Getting this right is one of the easier components of the process and getting it right maximizes every other component.
Rule No. 2: Use a team-by-team approach.
Many analysts still go position by position. While this process may lend itself to publishing rankings promptly for deadlines, it is inherently flawed. Team context is paramount. Without understanding a quarterback’s range of outcomes, how can you possibly project his pass catchers?
Rule No. 3: Establish checks and balances.
There are two types of quality checks. First, is the team level. At this level, individual player totals should never surpass team allotments. The projection process is designed to account for certain elements of this like passing attempts, targets, and rushes. Some other elements, such as receiving yardage versus passing yardage, need a quality checkpoint.

Second is the league level. At this level, team totals are summed together to contrast versus league averages. This step helps guard against cumulative inflation or deflation. The projection model shouldn’t predict 54% pass, and 46% run, for instance. That hasn’t happened in since 1992.

This table is from my first pass at projections this season. The league average for total attempts is 977 (sacks already removed) with a 57% pass and 43% pass to run ratio.
The Projection Process
This projection model focuses on three primary layers that are influenced by a multitude of factors.

How to account for each of these influencing factors and further break down each primary layer is accomplished by establishing a thorough and repeatable process.
Step No. 1: Study the changes between last seasons’ team and this seasons’ team.
During this step, you aren’t jumping to any conclusions. You are soaking in an initial baseline of data that you will need in later steps — this the first step to providing each team with a clean slate. A clean slate prevents last season equals this season type of lazy analysis.
- Note any coaching changes – understand their historical approach and tendencies.
- Note key contributors lost at all positions.
- Note key contributors gained via the draft and free agency.
- Capture any notes from post-draft interviews – this is the time coaches and team officials are most honest about their plans for rookies.
- Note players returning from injury.
- Note games players played with an injury.
All of these components are important, but the last one is easy to miss.
Did you know that Adam Thielen injured his calf in week nine of 2018? He didn’t show up on the final team injury report each week, but he missed practices or was limited most weeks after that. He also dealt with a cascade of other issues from hamstring to back problems after the calf issue flared up.
Thielen was on pace for 148 receptions, 1,850 yards, and 12 touchdowns over the first eight games. Immediately after the injury, it dropped to 78 receptions, 896 yards, and six touchdowns.
What is the main street narrative we hear on Thielen heading into 2019? Be leary, defenses figured him out, and Kevin Stefanski went to a heavier run approach once he took over for John DeFilippo.
While the Stefanski offense did move to more run, much of it was game flow dictated when Minnesota was blowing out the Dolphins and the Lions. The final game was against the Bears, one of the best defenses in the league.
There isn’t a mention of Thielen’s injury almost anywhere. Why? Because unearthing that type of information requires a structured process that drives diligence. If you were to miss this injury information it could cause you to believe the main street narrative and potentially under project Thielen’s role for 2019.
Step No. 2: Analyze vegas projected win totals.
Teams that win more games play from ahead more. Teams that lose more games play from behind more. Coaches have different tendencies based on playing from ahead, tied, and behind.
When first starting to create projections, my advice here is to stick pretty close to what Vegas says unless you have handicapping experience. If you are going to make adjustments, make sure you follow a consistent process or use a consistent source of information.
Step No. 3: Determine team volumes and rushing vs. passing splits.
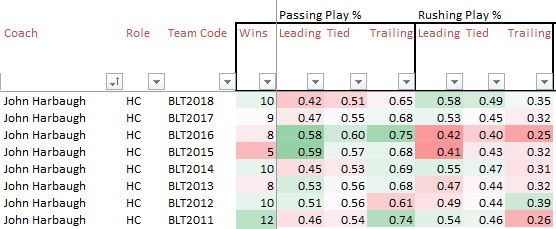
Projecting overall volume is one of the easiest steps. Coaches are typically pretty steady over two to three year periods. Using John Harbaugh as an example below, you can see his teams are often at the top of the league in plays – even though coordinators have varied. His pace also wasn’t impacted in a season where he trailed far more than normal.

Notice the difference in pass play percentage versus pass attempt percentage. Teams have fewer pass attempts than pass plays due to sacks. Make sure to understand how your data source works and account for this. I like to start projections with pass plays and then adjust using a projected sack rate.
Based on the team win total from step two, you can now estimate how often a team will be playing ahead, tied, and behind based on league averages.

Integrating this information with historical coaching tendencies by situation enables passing versus rush splits to be more accurately projected.
With this step completed, team volumes can now feed player level projections.
Step No. 4: Create team passing projections.
- Assign attempt percentage or games played percentage to each quarterback.
- Project passing efficiency based on historical quarterback performance, scheme changes, and roster changes.
- Level I efficiency data: Yards per attempt, touchdowns per attempt, completion percentage.
- Level II efficiency data: Deep passing, play action, under pressure, clean pocket, quick throws, patience throws.
You can create projections with level one efficiency data, but it is harder to project potential coaching scheme impact without it. Pairing a coaches schematic history with a players strengths and weaknesses provides a baseline of questions to monitor through preseason – especially if the scheme has changed.
A great example this year is the arrival of Gary Kubiak as an assistant head coach in Minnesota. Kubiak has a strong history of utilizing play-action pass more than the rest of the league at ~25% (minus years with Peyton Manning). Kirk Cousins thrives on play action passing, consistently averaging at least two yards more on a per attempt basis.

Think about the efficiency gains we have seen quarterbacks like Matt Ryan and Jared Goff achieve in similar schemes to Kubiak’s utilizing passing plays with play action that look like zone running plays. Kirk Cousin’s yards per attempt is going to increase in 2019.
Play action is just one example. Work through each element of the data with the same approach. Keep in mind that more downfield passing means a lower completion percentage. Bad offensive line play or a quarterback taking to long to throw can lead to more pressure.
Level two data will cost you money, but it is well worth it. I utilize Pro Football Focus, but there are other sources as well.
Step No. 5: Create team rushing projections.
- Allocate a percentage of rushes to each back and the quarterback based on player history, coaching tendencies, and roster construction.
- Project rushing efficiency for each back.
- Level I efficiency data: Yards per rush, touchdowns per attempt.
- Level II efficiency data: Percentage of 15 yards or more rushes (explosive runs).
It is very important not to get carried away with yards per rush. It is not a sticky statistic from year to year and is tough to predict. If you don’t utilize a fairly tight range of outcomes, you can ruin all of the hard work you have done to this point. For runners, the volume is king. Let it rule.
I use a range of 4 to 4.75 yards per rush across all backs. I project the majority between 4 and 4.5 yards per rush. If a back consistently breaks explosive runs at 5%-6% or more over a couple of seasons of data, I will consider them for the top end of the range. This metric is a bit more stable than yards per rush because it is equalizing the two runs a back took for 50 yards. He still gets credit for an explosive run, but the luck component (long field position) becomes less impactful.
Be careful with small sample sizes for change of pace backs facing favorable situations where defenses strategically invite the offense to run.
Step No. 6: Create receiving projections.
Define team pecking order for targets based on roster construction and coaching history
Coaching history matters for some coaches more than others when it comes to utilizing pass catchers. Much of the time this is more to do with the receiving talent and the quarterback. Passers will gravitate quickly to who is gaining consistent separation regardless of scheme.
A good example of a strong trend is Bruce Arians’ usage of the big slot receiver. In seven of ten seasons, the slot receiver has led the team in pro-rated target share. Now consider the roster construction of those teams. Were their other talented receiving options or was the slot just the best receiver?
The list encompasses twilight versions of Hines Ward, Reggie Wayne, and Larry Fitzgerald. In some case, there were other solid targets around them (Ward and Fitzgerald), and in others, there was less (Wayne).
Overall, this tendency is pretty strong, and at a minimum demands consideration that Chris Godwin could receive similar targets to Mike Evans.
For a bad example, we can stay with the same coach. Arians’ hasn’t used his tight end at all over the past several seasons. However, he hasn’t had a talented one like O.J. Howard. If you go back further in Arians’ history, you will find Heath Miller with a healthy 16% and 17% pro-rated target shares.
This tendency is weak, and the team pecking order of talent should win out.
- Project pass-catching roles based on the scheme and history (deep, intermediate, and underneath).
- Project catch rate based on player history and scale based on projected role (catch rate drops as the average depth of target rises).
- Project yards per catch.
- Project touchdown allocation (utilize red zone and inside the five data).
Parting Thoughts
Some projections will deviate from your baseline much more than others through the preseason as you integrate new insights. A great example this year is the Cardinals.
We have an innovative young new coach, mostly unproven receivers, and a rookie quarterback. Preseason data points will drastically influence how we see reception distribution and passing efficiency.
When projecting teams like this the first time, don’t over analyze your projections. The key is to establish placeholders and have a strong baseline of information headed into the next round of analysis – the preseason.
Don’t force yourself to allocate every rush, target, touchdown, and yard. With some teams, you may only project the top four receiving targets. That is fine –be sure to leave headroom for the players not projected.
Other projections shouldn’t deviate much from your baseline. If an offense has a long track record, don’t fall for the puff pieces and coach speak. Be willing to adapt, but don’t overreact.
Remember that coach speak is relative. When a coach says, a certain player is going to be the lead contributor at a position he is likely speaking in relative terms to the rest of the players. If Matt Patricia says this about Kerryon Johnson, that only means he will lead the backfield in touches which we already know. It doesn’t mean he will see 65% of the carries.
What we need to know is if Johnson is going to take the passing down role from Riddick and if Johnson will get the short yardage work or if C.J. Anderson is expected to help in that role similar to LeGarrette Blount in 2018.
If momentum is continuing around a player based on incremental developments rather than rehashing the same story then pay attention. For each team, you should have an idea of what storylines are most important after your first round of projections. These are the variables you know you must solve to get projections right.
If you have read to this point, I know you are serious about creating projections. I hope this process helps you and you continue to iterate and tweak it to improve continually. If you do, please be sure to let me know. I am always looking to improve.
You can follow and interact with Dwain on Twitter @dwainmcfarland.
For the most in-depth analysis of offensive skill players available (QB, RB, WR, and TE), get the 2019 Rookie Scouting Portfolio. If you’re a fantasy owner the Post-Draft Add-on comes with the 2012 – 2018 RSPs at no additional charge.
Dwain will be providing individual projection analysis in the monthly RSP Newsletter at various points between July and December.
Best, yet, 10 percent of every sale is donated to Darkness to Light to combat sexual abuse. You can purchase past editions of the Rookie Scouting Portfolio for just $9.95 each. You can pre-order the 2019 RSP now (available for download April 1).
8 responses to “RSP’s Dwain McFarland: How to Project NFL Offenses”
Very informative. Keep up the good work. RSP is the gift that keeps giving.
Thanks, Bob.
Really helpful Dwain, is there a way we can get our hands on your current projections or last years? I’m new to this site and am trying to create my own projections for the first time.
Alex, we’ve been covering our projections of offenses on a series of podcasts….https://mattwaldmanrsp.com/?s=Dwain+McFarland+&x=0&y=0
Thanks, Alex. As Matt mentions you can listen to the pods. At this point, I am not sharing them but am considering how I might do this moving forward. You can also follow me on twitter @dwainmcfarland where I sometimes share my team projections and ongoing changes.
Dwain, where o you get your stats, particularly the coaches tables?
Thanks
Roger, there are a ton of different data points in the coaching table so not sure which ones you are referencing. I get all of the team level data from http://www.profootballreference.com and player level data comes from http://www.profootballfocus.com and nfl.com Next Gen Stats.
[…] in previous podcasts, I highly recommend reading McFarland’s new piece at the RSP site on How to Project NFL Offenses. If you’re a fantasy player, NFL beat writer, or football analyst, you should consider learning […]