

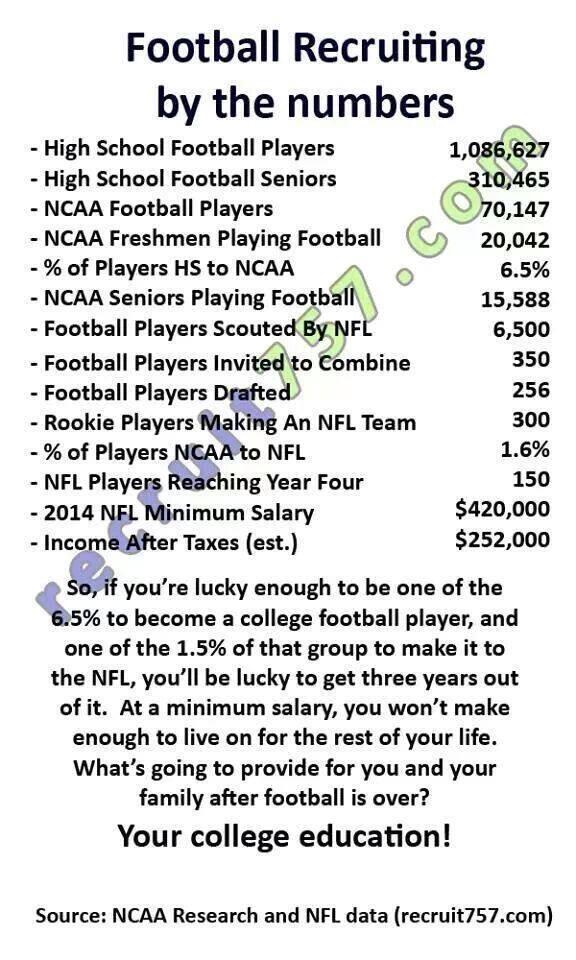
Based on these numbers, less than 1 percent of the seniors playing college football will ever earn a second contract in the NFL.
Greg Linton, an NFL agent, shared this on Twitter this morning. There’s another salient point embedded in this data that goes beyond the message of “get your education.” It’s how data displays the differences in execution. It is a great way to see the differences between “good” college football and “good” NFL football.
Only the top 6.5 percent of all high school players compete at the college level. It means they are in the 93.5 percentile of all high school players. Likewise, only the top 1.6 percent of all college players enter the NFL–the 98.4 percentile. And that second NFL contract–the seal of approval that you’re a good NFL player–is reserved for less than one percent of all college players; the 99.06 percentile.
Viewing the numbers in this fashion, it doesn’t look like a big difference between the 93.5 percentile, the 98.4 percentile, and the 99.06 percentile. You’d be mistaken.
This may be a stretch for some–and it certainly isn’t scientific–but for the sake of entertainment, let’s presume that these percentiles were a reflection of a player’s success rate executing plays on a per snap basis. I understand this is not exact, but I think there’s enough to this idea to suspend disbelief long enough to make an overall point that is worthwhile.
The table below shows the amount of errors–or bad plays–that a player would commit over the course of a million plays based these percentiles that represent their standing as a college (93.5 percentile), NFL prospect (98.4 percentile), or NFL vet earning a second contract (99.07 percentile).
| Plays | Percentile | Good Plays | Errors/Bad |
| 1,000,000 | 0.935 | 935,000 | 65,000 |
| 1,000,000 | 0.984 | 98,4000 | 16,000 |
| 1,000,000 | 0.9906 | 99,0600 | 9,400 |
The difference between 65,000 errors and 16,000 errors is massive and that’s just the gap between a college player and NFL prospect who might last three years in the league. The NFL vet who earns a second deal commits 42.3 percent fewer errors than the prospect ad 86.6 fewer errors than the college player. And I’m talking about the average player on a team, which includes the best and the worst players on each squad–forget about the stars!
Even these numbers are a little harder to grasp, because we’re looking at a million plays. We won’t see any player execute that many over the course of a career–as hard as Brett Favre, George Blanda and Bruce Matthews tried.
So let’s break it down to plays in a season. Let’s estimate a player sees 40 plays a game for 16 games. I know this isn’t completely accurate for the college game or certain players in the NFL. However, it’s a more understandable sample size of plays for a season that equates to 640 plays.
Now look at the differences in errors/bad plays–it’s a lot easier to grasp.
| Player | Plays | Percentile | Good Plays | Errors |
| College | 640 | 0.935 | 598.4 | 41.6 |
| NFL Prospect | 640 | 0.984 | 629.76 | 10.24 |
| NFL Vet | 640 | 0.9906 | 633.984 | 6.016 |
The difference between 10 and 6 egregious errors per season per player is staggering–and that’s the difference between a young NFL player and a veteran. Those 41.6 errors per season for the average college player just doesn’t cut it for the pro game. This chart hints at why NFL athleticism is a difference maker in the college game even if the NFL skill and understanding of football isn’t always present.
In contrast, the gap between a prospect and vet is much smaller from an athletic standpoint, but the differences in errors is still large based on knowledge of technique, strategy, and consistency of execution. Again, this is hypothesizing that we’re discussing the average player at each level.
Now think about the top four players on each team–Pro-Bowl caliber players–that’s 128 players in the NFL. These players are in the 99.88 percentile in all of football–high school, college, and NFL. Using a sample of 640 plays in a 16-game season they would commit .75 egregious errors.
This seems hard to believe. In fact, you can see where this theory begins to crack at the seams because even All-Pros make mistakes multiple times in a season. However, how many of them are solely their fault and not something that can be explained by the error of a teammate? Not as many as you might think.
I wouldn’t throw out this examination because the numbers aren’t exactly right. The point is still a good one: The gap in talent is about consistency of execution and it requires knowledge, skill, and focus as the gap in athleticism narrows.
For analysis of skill players in this year’s draft class, download the 2014 Rookie Scouting Portfolio. Better yet, if you’re a fantasy owner the 56-page Post-Draft Add-on comes with the 2012 – 2014 RSPs at no additional charge and available for download within a week after the NFL Draft. Best, yet, 10 percent of every sale is donated to Darkness to Light to combat sexual abuse. You can purchase past editions of the Rookie Scouting Portfolio for just $9.95 apiece.
7 responses to “A Game of Inches: The Talent Gap By the Numbers”
very cool and sobering analysis
Matt:
It’s actually worse than you’re saying. The original post meant that only 6.5% of high school players play in college: and only 1.5% *of that 6.5%* play in the NFL. So in terms of percentiles of high school football athletes: college football players are in the 93.5 percentile, NFL rookies are in the 99.972 percentile, and those who get the second contract are in the 99.9986 percentile. (Just divide the number of players that reach each point by the total number of high school players, and subtract that from 1).
Really, really stresses the point with those numbers.
[…] A Game of Inches: The Talent Gap Shown With Data […]
[…] Waldman (Rookie Scouting Blog) A game of inches: The talent gap by the numbers. /Interesting […]
[…] A Game of Inches: The Talent Gap Shown With Data […]
[…] has had a lot of success not to realize how much work he truly has to do to get better. Remember, the fine details are the small things that spell a huge gap between college and pro talent. Without a clear perspective of self, it might be difficult to see […]
[…] A Game of Inches: The Talent Gap By the Numbers […]